Geospatial inference for renewables investors: Transforming new data sources for investment analysis


Many wind assets today are experiencing unexpected increases or decreases in output, even beyond what’s expected given the noisy nature of wind power generation. State of the art climate models show non-uniform changes in long-term wind resources, with changes varying across regions and expected to be as large as ±30%.
These shifts will be highly disruptive to the wind industry, which relies on historical observations to predict future performance, so teams are starting to seek explanations on and solutions to the changes, including multiple firms that have approached Sust Global.
Investors and advisors can’t solve this problem themselves because they don’t have the expertise to fuse the complex data layers – physics-based data, spatial data, financial models, wind turbine performance data – necessary to incorporate the changes into their models. However, Sust Global has harnessed new machine learning and data processing technologies enabling it to unlock insights from these multi-modal datasets to help investors achieve superior risk-adjusted returns by deploying capital with more accurate models of future performance.
Sust Global’s proprietary spatial inference and data processing architecture enable the fusion of complex physics-based modeling and spatial data signals with financial data. These processes power the creation of high-resolution wind energy generation projections for any wind asset on earth and custom metrics to help investors assess and act on portfolio risks and opportunities – both for today and future years.
Sust Global generates these insights through multi-modal data harmonization, geospatial transformation and user-centric data composition:
Figure 1: Sust Global’s geospatial inference process and wind power generation projection workflow. Sust Global begins by collecting and harmonizing multi-modal datasets, then it uses its geospatial inference engine to generate insights from the various datasets, finally it produces bespoke data outputs based on user needs.
 1. Aggregating and harmonizing multi-modal datasets
Understanding changing climactic patterns, and the financial implications of these changes requires highly elaborate systems that coordinate across many different types of data, including:
Physics-based models of future climate conditions
Spatial datasets and observations from terrain maps or satellite imagery
Observational datasets from ground truth measurements
Asset-specific datasets, such as power curves, availability factors, and historic project performance data
Metrics and investment models used by financial analysts
The inclusion of these industry-specific datasets enables inferences across data types to bridge the gap between climate and finance.
Once the datasets are aggregated and harmonized, Sust Global’s proprietary geospatial AI engine enables AI-powered inference between these disparate data types.
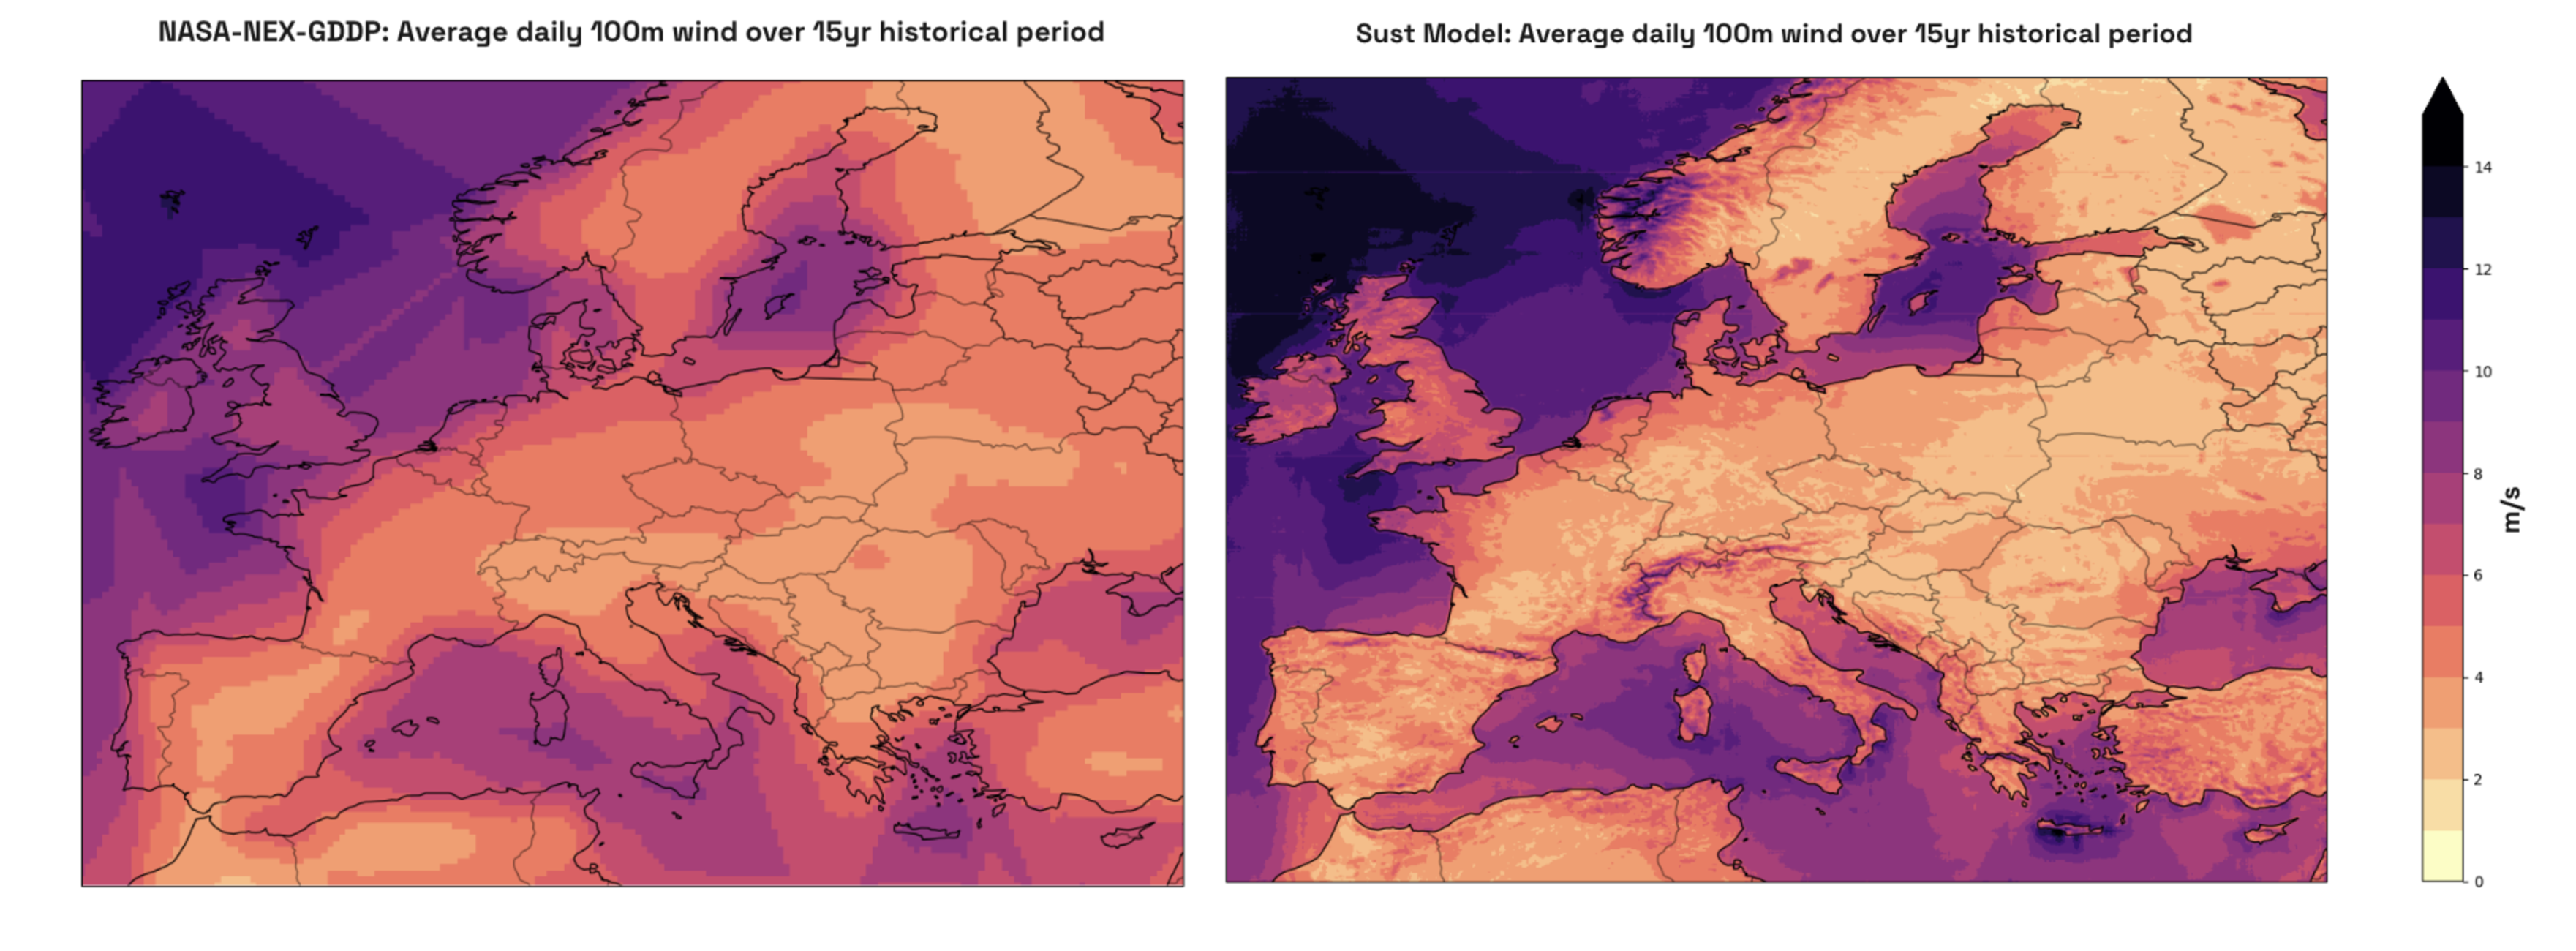
This approach leverages Large Vision Models to draw inferential insights from datasets and enables the creation of wind speed projections that are much higher spatial resolution when compared to state of the art alternatives.
Figure 2: NASA-NEX-GDDP (left) wind speed model projections from 2000-2015 vs. Sust Global (right) wind speed model projections for the same period. Sust Global’s projections are 5x higher resolution than NASA-NEX-GDDP’s, the current previous best-available forward-looking wind speed models.
 Turbine model and other site-level data is added, producing high-resolution wind power generation projections for any wind asset globally.
From these high-resolution wind power generation projections, Sust Global can compose user-centric outcomes enabling wind investors to make better informed decisions.
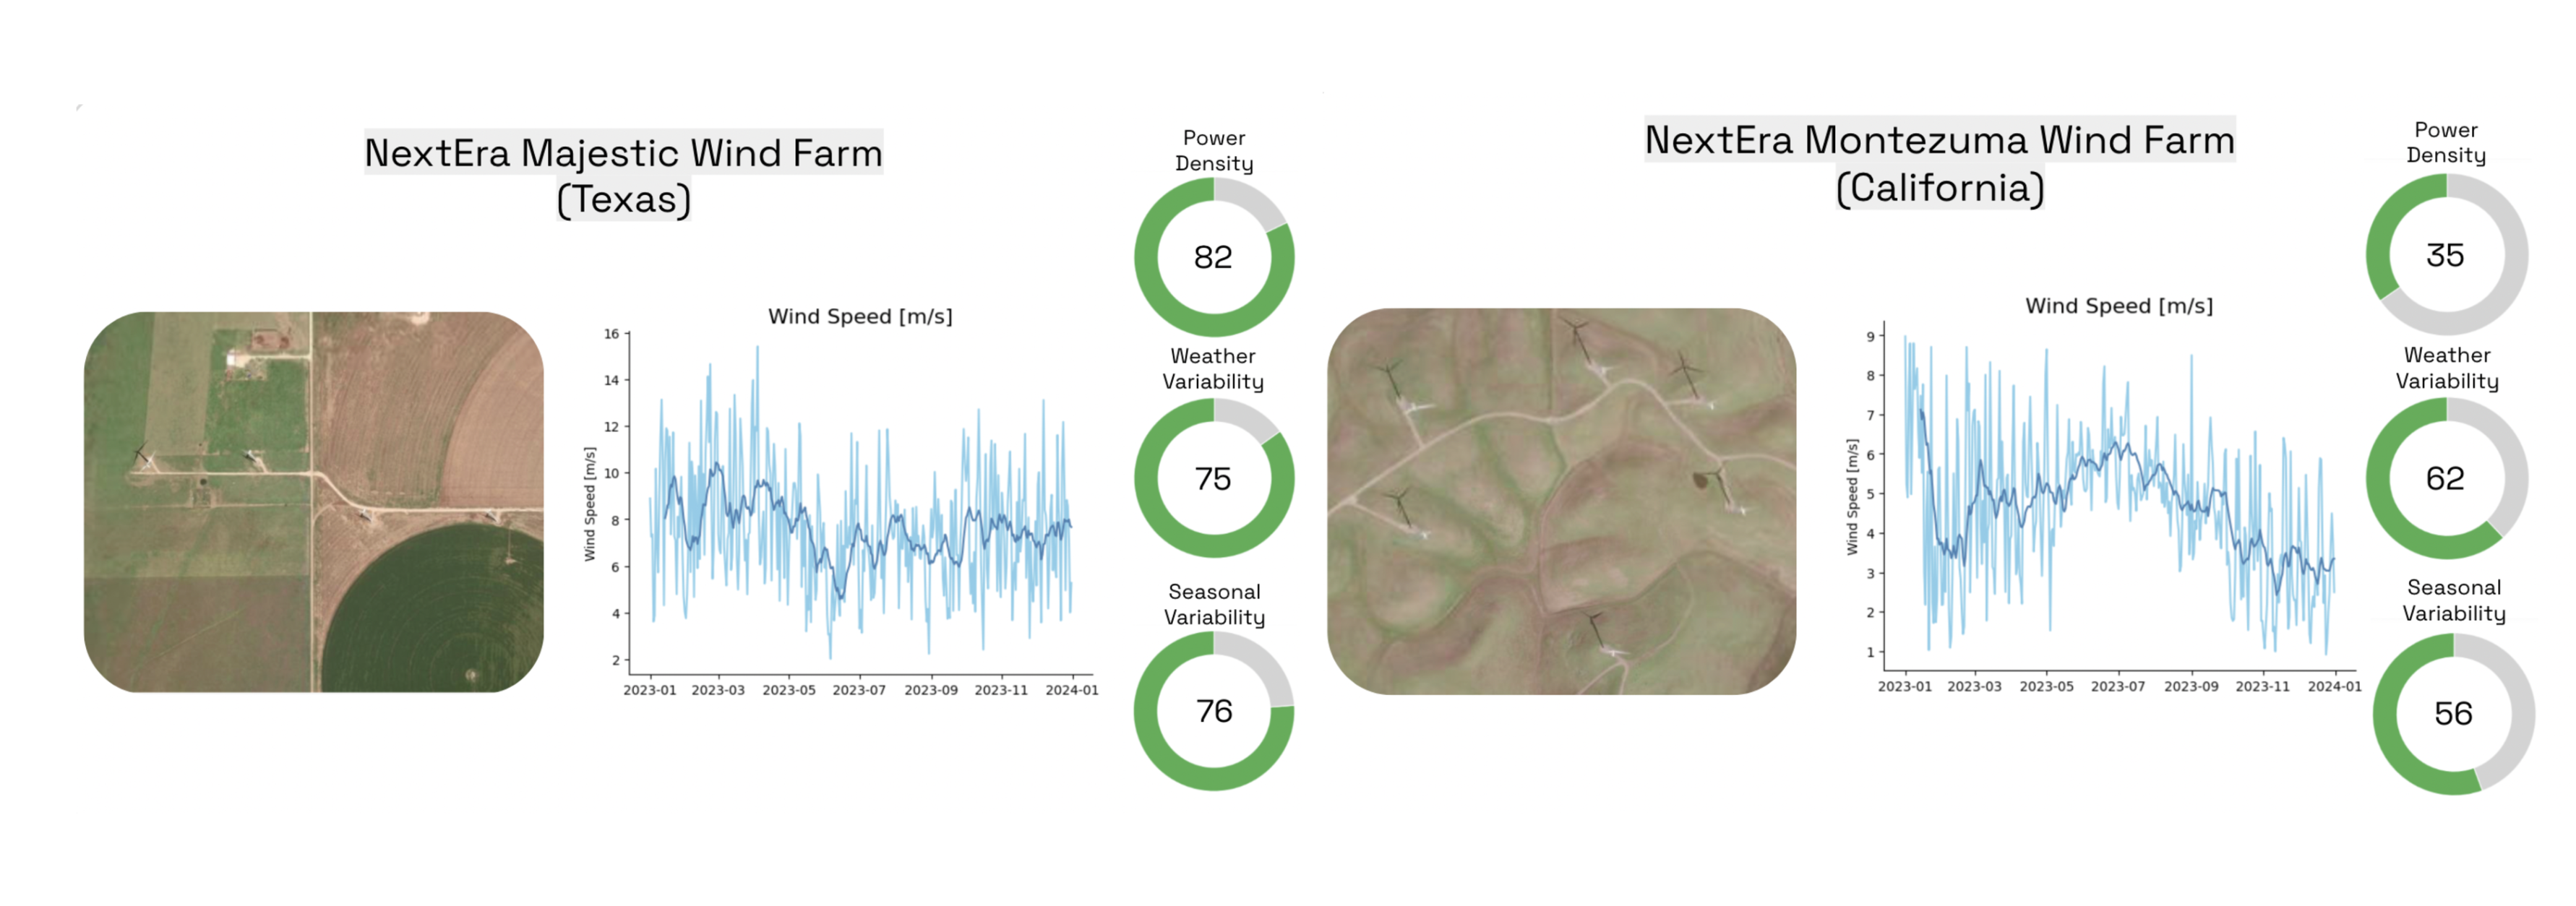
Derivative metrics can be served from the underlying wind power generation projection data, including mean projections, probability figures (P50, P75, P90, etc.), and relative change over time estimates. Additionally, bespoke analytics, such as climate-adjusted capacity factors or seasonal variability scores, can be constructed to power custom analysis where unique data outputs are necessary.
Sust Global is focused on building outputs that integrate into existing financial workflows and enable climate factors to be quantitative inputs into financial models, so it works with teams to understand what outputs will be most impactful for them.
Figure 3: Sust Global can serve various custom analytics that give investors better insight into a wind farm’s performance. For example, investors can view a wind farm’s weather and seasonal variability metrics which provide insight into a wind farm’s intra- and inter-seasonal volatility helping them better understand the risks associated with a wind farm.
 These outputs can be served to investors through a variety of channels – CSV file, data dashboard, direct API, or third party integration – ensuring minimum friction integration into existing processes.
A large wind infrastructure asset manager approached Sust Global to understand how changing wind speeds would impact their wind assets to assess new risks and opportunities from changing wind patterns, and show LPs that they have a robust, climate-aware investment process.
Sust Global worked with members across their organization in their investment, asset management, and sustainable investing teams, and enabled unique geospatial insights that mapped each wind asset in their portfolio and provided portfolio-wide metrics on relative wind speed changes and risk.
Deeper analysis on future generation in P50, P75, and P90 scenarios was accompanied by confidence interval metrics to provide transparency and context for informed use.
The team could also review prospective investments to aid their asset valuation and investment processes enabling them to see which sites were most at risk of deviating from their on-site energy yield analyses. The data could be accessed via a portfolio view dashboard or as a downloadable CSV file that contained a power generation time series that integrated directly into their project finance models.
In addition to supporting investment and asset management decisions, the dashboard views aided their communications to their LPs demonstrating their high preparedness for climate impacts and provided them with a high level overview of risky vs. attractive regions.
Figure 4: A view of Sust Global’s dashboard, showing a portfolio of all energy generation assets owned by publicly-owned US utilities. Portfolio-wide metrics can be viewed in the “Summary” section, and individual asset analytics can be viewed by clicking each of the individual assets. Additional data, such as a power generation time series for each wind site, is available by clicking the “Download” button.

So far, we’ve analyzed how changing wind speeds will affect energy generation. However, changing climate patterns can impact financial performance in many more ways:
Energy demand changes: Our inference engine draws insights from how changing climate patterns, and the resulting need for heating or cooling on extreme temperature days, interact with other trends, such as demographic changes or vehicle electrification, to better predict future energy demand.
Energy supply changes: Our inference engine projects how changing wind speeds will increase/reduce wind energy generation across a country or region and the resulting effects on overall energy supply and prices
Transmission network analytics: A related asset with high climate exposure is transmission and distribution network infrastructure. Sust Global’s linear asset capabilities enable it to map transmission networks and power grids to quantify risks that T&D investors face.
Figure 5: Sust Global’s geospatial approach enables linear asset mapping capabilities that help investors assess risks to energy transmission and distribution networks.
 These new analytics each leverage Sust Global’s ability to incorporate multi-modal datasets and tie climate into other forms of analysis in the wind investment industry. They also go a step further in creating a climate-informed financial model enabling investors to more accurately value their investments.


We use cookies to give you the best online experience. Please let us know if you agree to all of these cookies.