Written By:
Tristan Ballard
Multimodal AI Shows Climate Isn’t Acting Alone in the Insurance Crisis

Executive summary
While climate risk is a significant driver of insurance market volatility, our research shows that a complete understanding requires analyzing both climate hazards and socioeconomic variables together.
Our multimodal AI framework integrates Population Dynamics Foundation Model embeddings, climate risk metrics, demographic data, and housing information to predict insurance outcomes at unprecedented spatial resolution.
Feature importance analysis reveals that future climate projections—not just historical events—are already influencing today's insurance decisions, with tropical cyclones and wildfire risk among the top drivers of non-renewals.
Geographical analysis of model outputs shows distinct regional patterns across the U.S. where specific factors like cyclone risk in coastal areas on the East Coast and wildfire risk on the West Coast disproportionately drive insurance volatility.
The synthesis of climate and socioeconomic data within a single AI model provides a powerful lens for understanding the emerging climate-driven insurance crisis.
The necessity of multimodal analysis
In our previous insights post, we introduced Populous, the first US-wide AI framework capable of predicting critical insurance market metrics at fine spatial resolution. As insurance premiums surge and non-renewals proliferate across the United States, understanding what's driving these market shifts is increasingly critical for institutional investors, policymakers, and homeowners alike.
While the connection between climate change and insurance instability is intuitive, the full picture is more nuanced. Our research demonstrates that accurately modeling insurance dynamics requires incorporating both climate variables and broader geospatial context—from demographic indicators and economic metrics to housing characteristics and population patterns.
To understand where and why insurance is retreating, we need to look beyond the climate signal and take a multimodal approach. As we'll show, future climate projections are already influencing today's insurance decisions—but their impact unfolds in combination with socioeconomic factors that vary dramatically across regions.
Opening the AI black box: Understanding what drives predictions
One common critique of machine learning models is their "black box" nature, where inputs go in and predictions come out without clear explanations of the decision-making process. To address this limitation in our insurance market model, we employed two complementary techniques to identify which factors most strongly influence predictions: feature importance analysis and SHAP (SHapley Additive exPlanations) values.
While feature importance gives us a broad view of which variables matter most across the entire dataset, SHAP values provide more granular insights by quantifying exactly how each feature contributes to individual predictions. In simple terms, SHAP values help us understand not just what factors matter overall, but how much each factor matters for specific locations and outcomes.
For those unfamiliar with the concept, SHAP values are based on game theory and provide a way to fairly distribute the "credit" for a prediction among various features. A positive SHAP value indicates that a particular feature pushed the prediction higher than the baseline, while a negative value suggests it lowered the prediction.
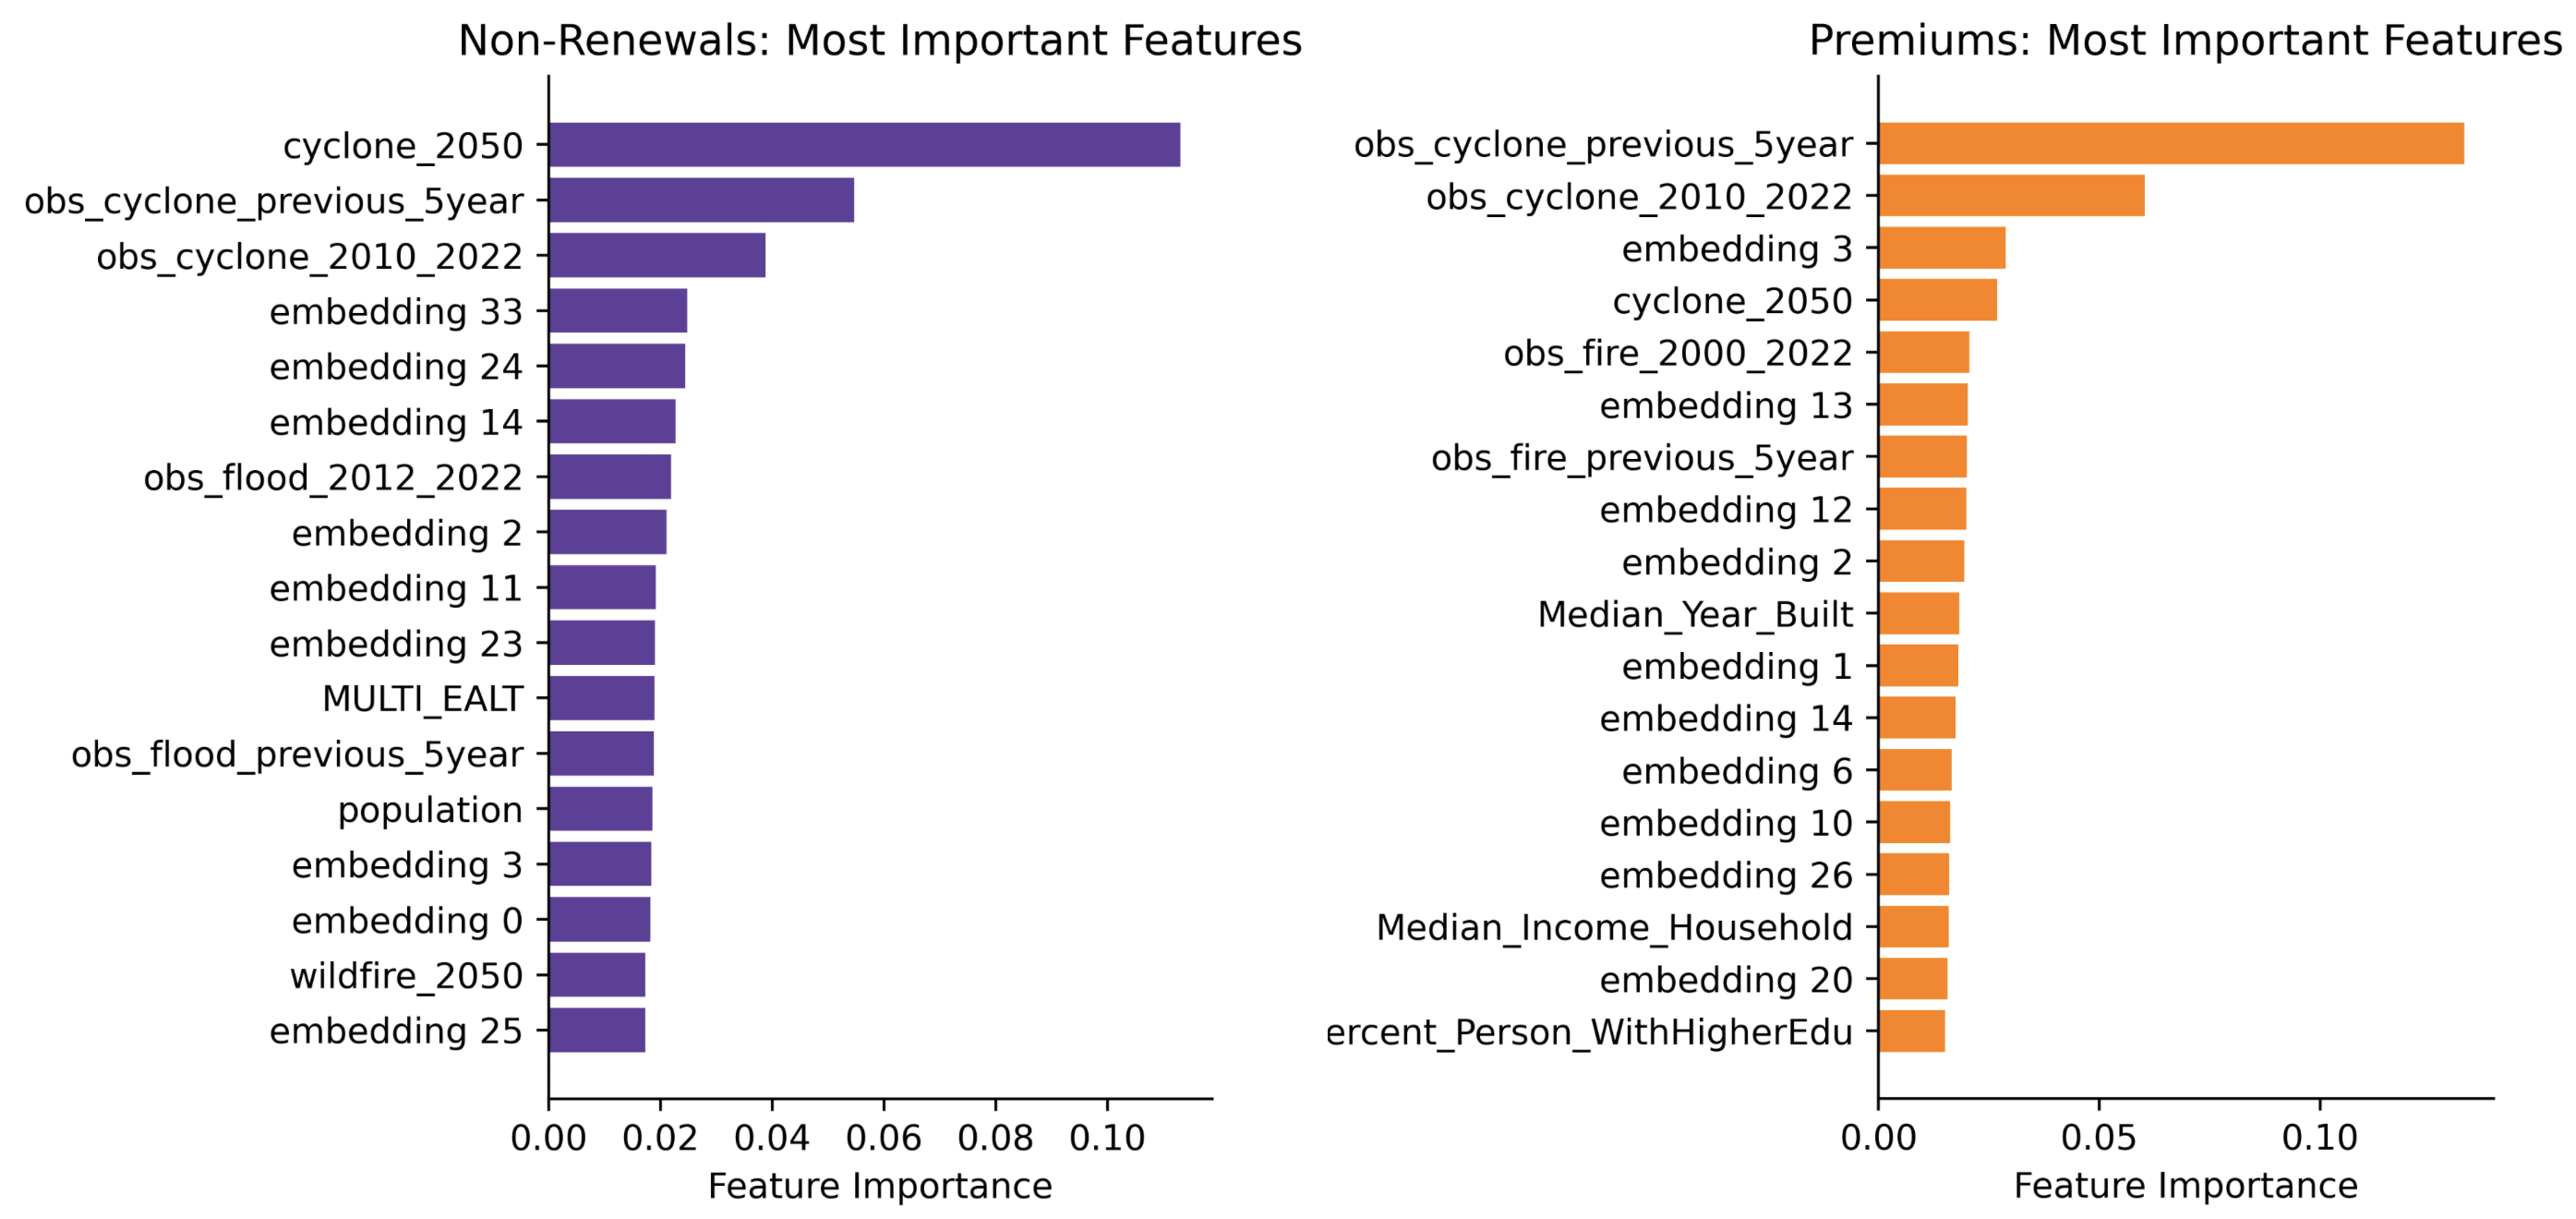 Figure 1: Top Variables Influencing Insurance Non-Renewals and Premium Models. Past climate hazards and future climate risk are among the most influential features for nationwide county-level non-renewals (left) and premiums (right), particularly tropical cyclones (hurricanes).
What's driving insurance non-renewals? It's not just today’s risk
Figure 1 shows that climate hazards—particularly tropical cyclones (hurricanes), wildfires, and flooding—are among the top drivers of recent trends in insurance markets nationwide.
When we examine the SHAP values for our non-renewal model (Figure 2), excluding embedding features which are difficult to interpret directly, we find that the top five most influential county-level features are:
2050 projected cyclone risk (future climate risk)
Median household income (socioeconomic factor)
2050 projected wildfire risk (future climate risk)
Total housing units (housing market factor)
Population (demographic factor)
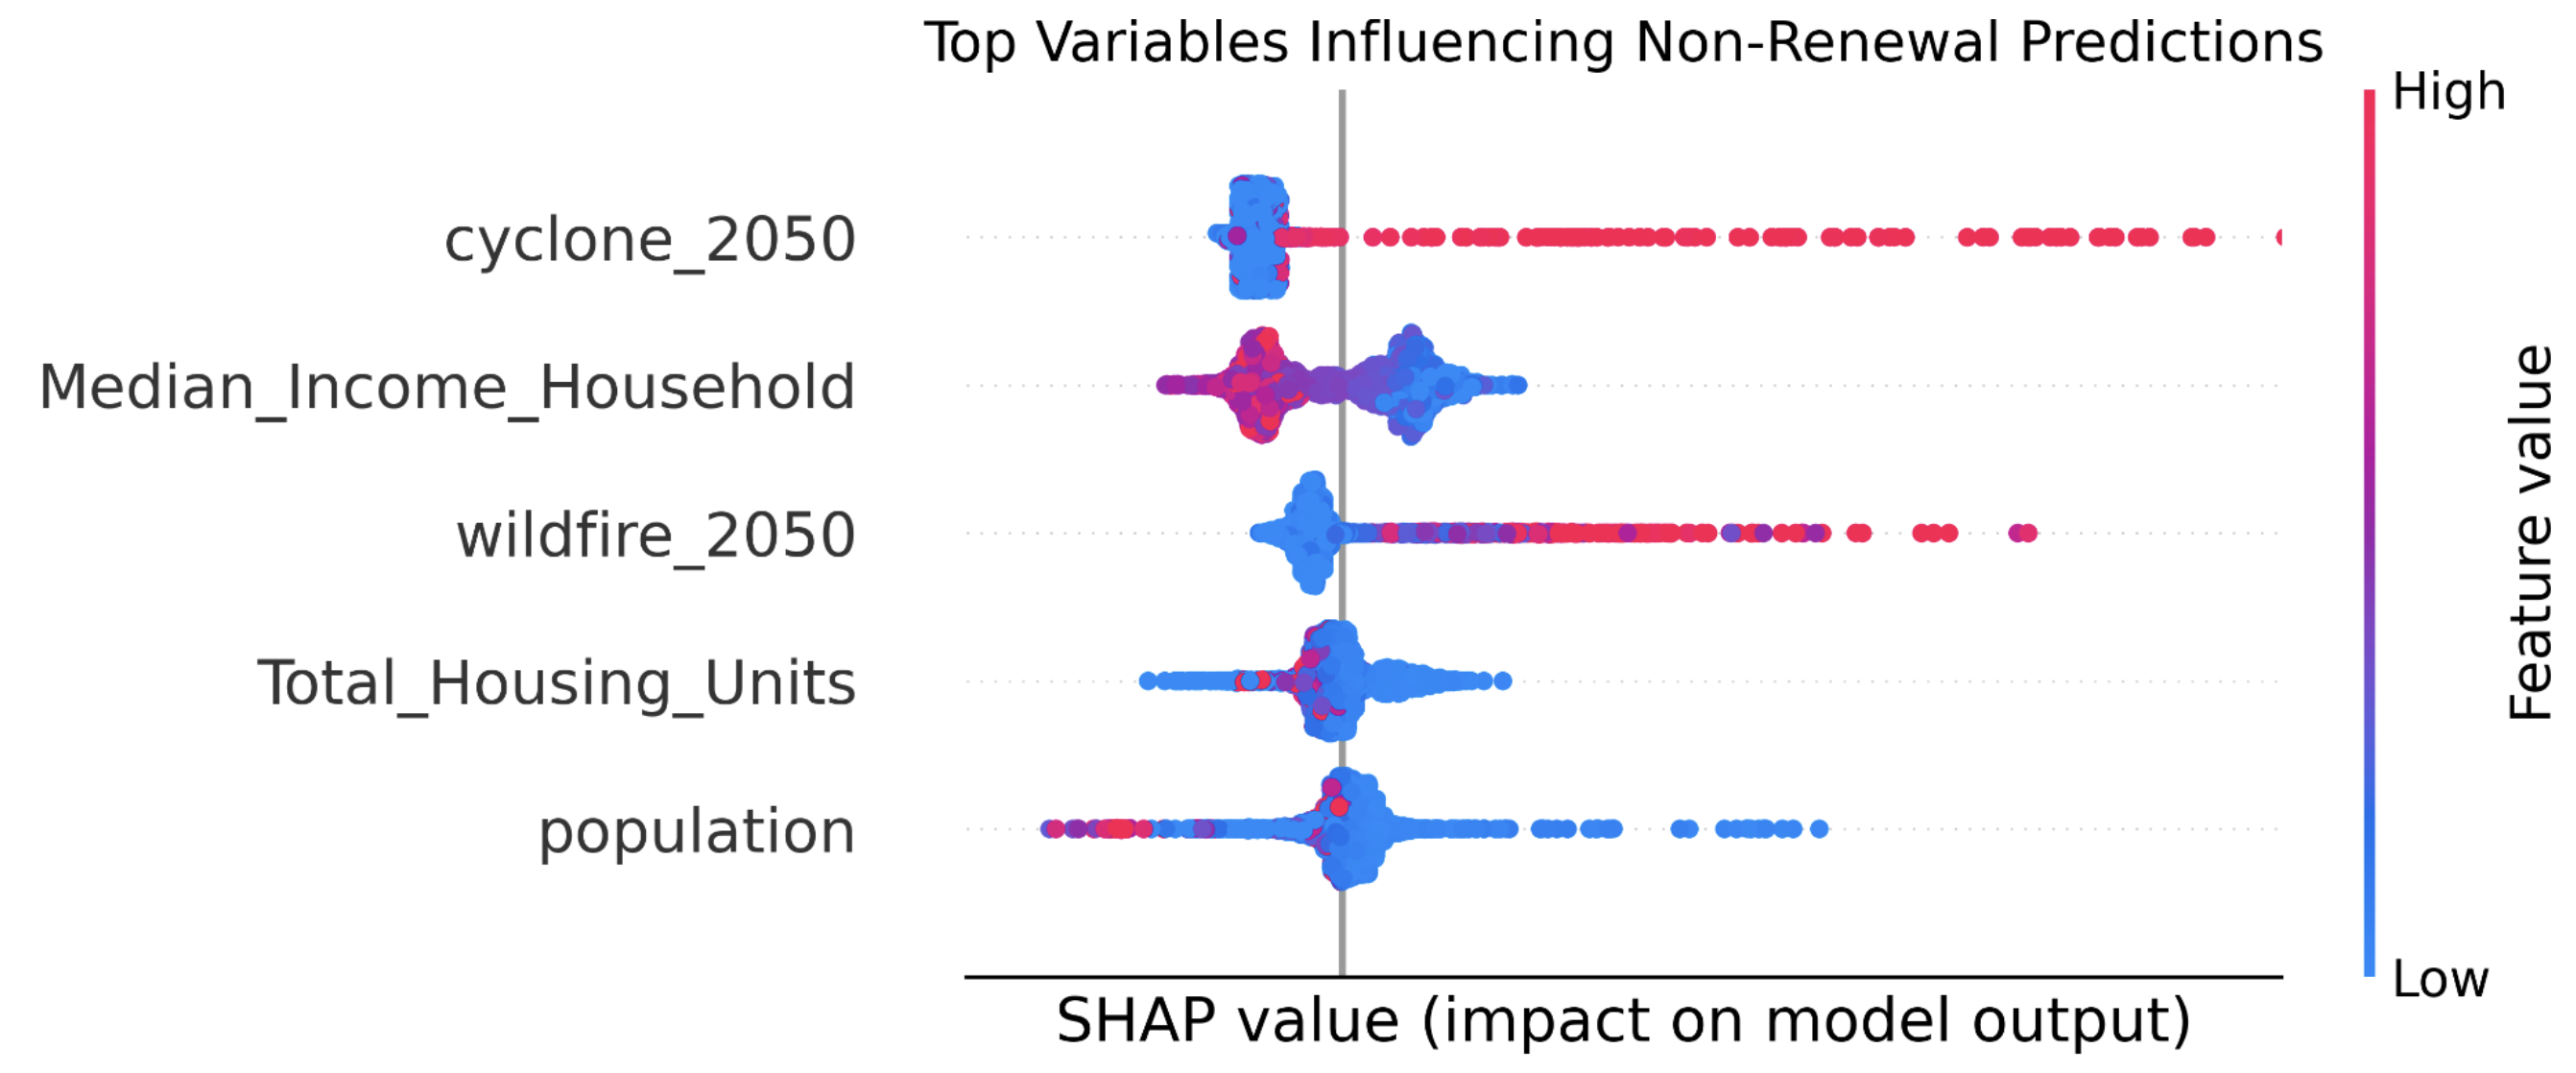 Figure 2: SHAP values illustrating how future climate risks and socioeconomic factors influence insurance non-renewal predictions. Each point represents a county; color indicates the feature value (red = high, blue = low). Points to the right of the vertical line indicate that the feature increased the model's predicted likelihood of non-renewal, while points to the left indicate a decreased likelihood. For example, in the Median Household Income row, the cluster of red points on the left shows that counties with higher income levels tended to reduce predicted non-renewal risk.
This analysis reveals something remarkable: insurance companies aren't just responding to current or historical events—they're making decisions based on anticipated future shifts in exposure over the lifetime of a typical 30-year mortgage. The prominence of 2050 projections for both cyclones and wildfires suggests that insurers are increasingly incorporating long-term climate forecasts into their risk management strategies.
The high importance of 2050 projected cyclone risk in our model reflects how forward-looking climate risk assessments are influencing current insurance decisions. This variable (“cyclone_2050”) represents the probability of a Category 1 or stronger hurricane affecting a county by 2050, providing a probabilistic view of future extreme weather exposure. While the specific forecast year (whether 2040 or 2050) matters less, the crucial insight is that insurers are responding to projected future risks rather than just historical patterns. This suggests a fundamental shift in the industry's approach—instead of pricing solely based on past events, companies are increasingly factoring in anticipated climate changes over the coming decades. This forward-looking stance helps explain why some areas with limited historical hurricane damage are nonetheless experiencing market disruptions today.
But equally important is the strong influence of socioeconomic and demographic variables like median household income, housing stock, and population. This underscores that the insurance crisis isn't solely climate-driven—it emerges from the complex interaction between physical hazards and social vulnerability.
Spatial patterns explain the impact of specific factors
To better understand how these top factors influence insurance non-renewals across different regions, we visualized the SHAP values for the three most important features at the county level (Figure 3).
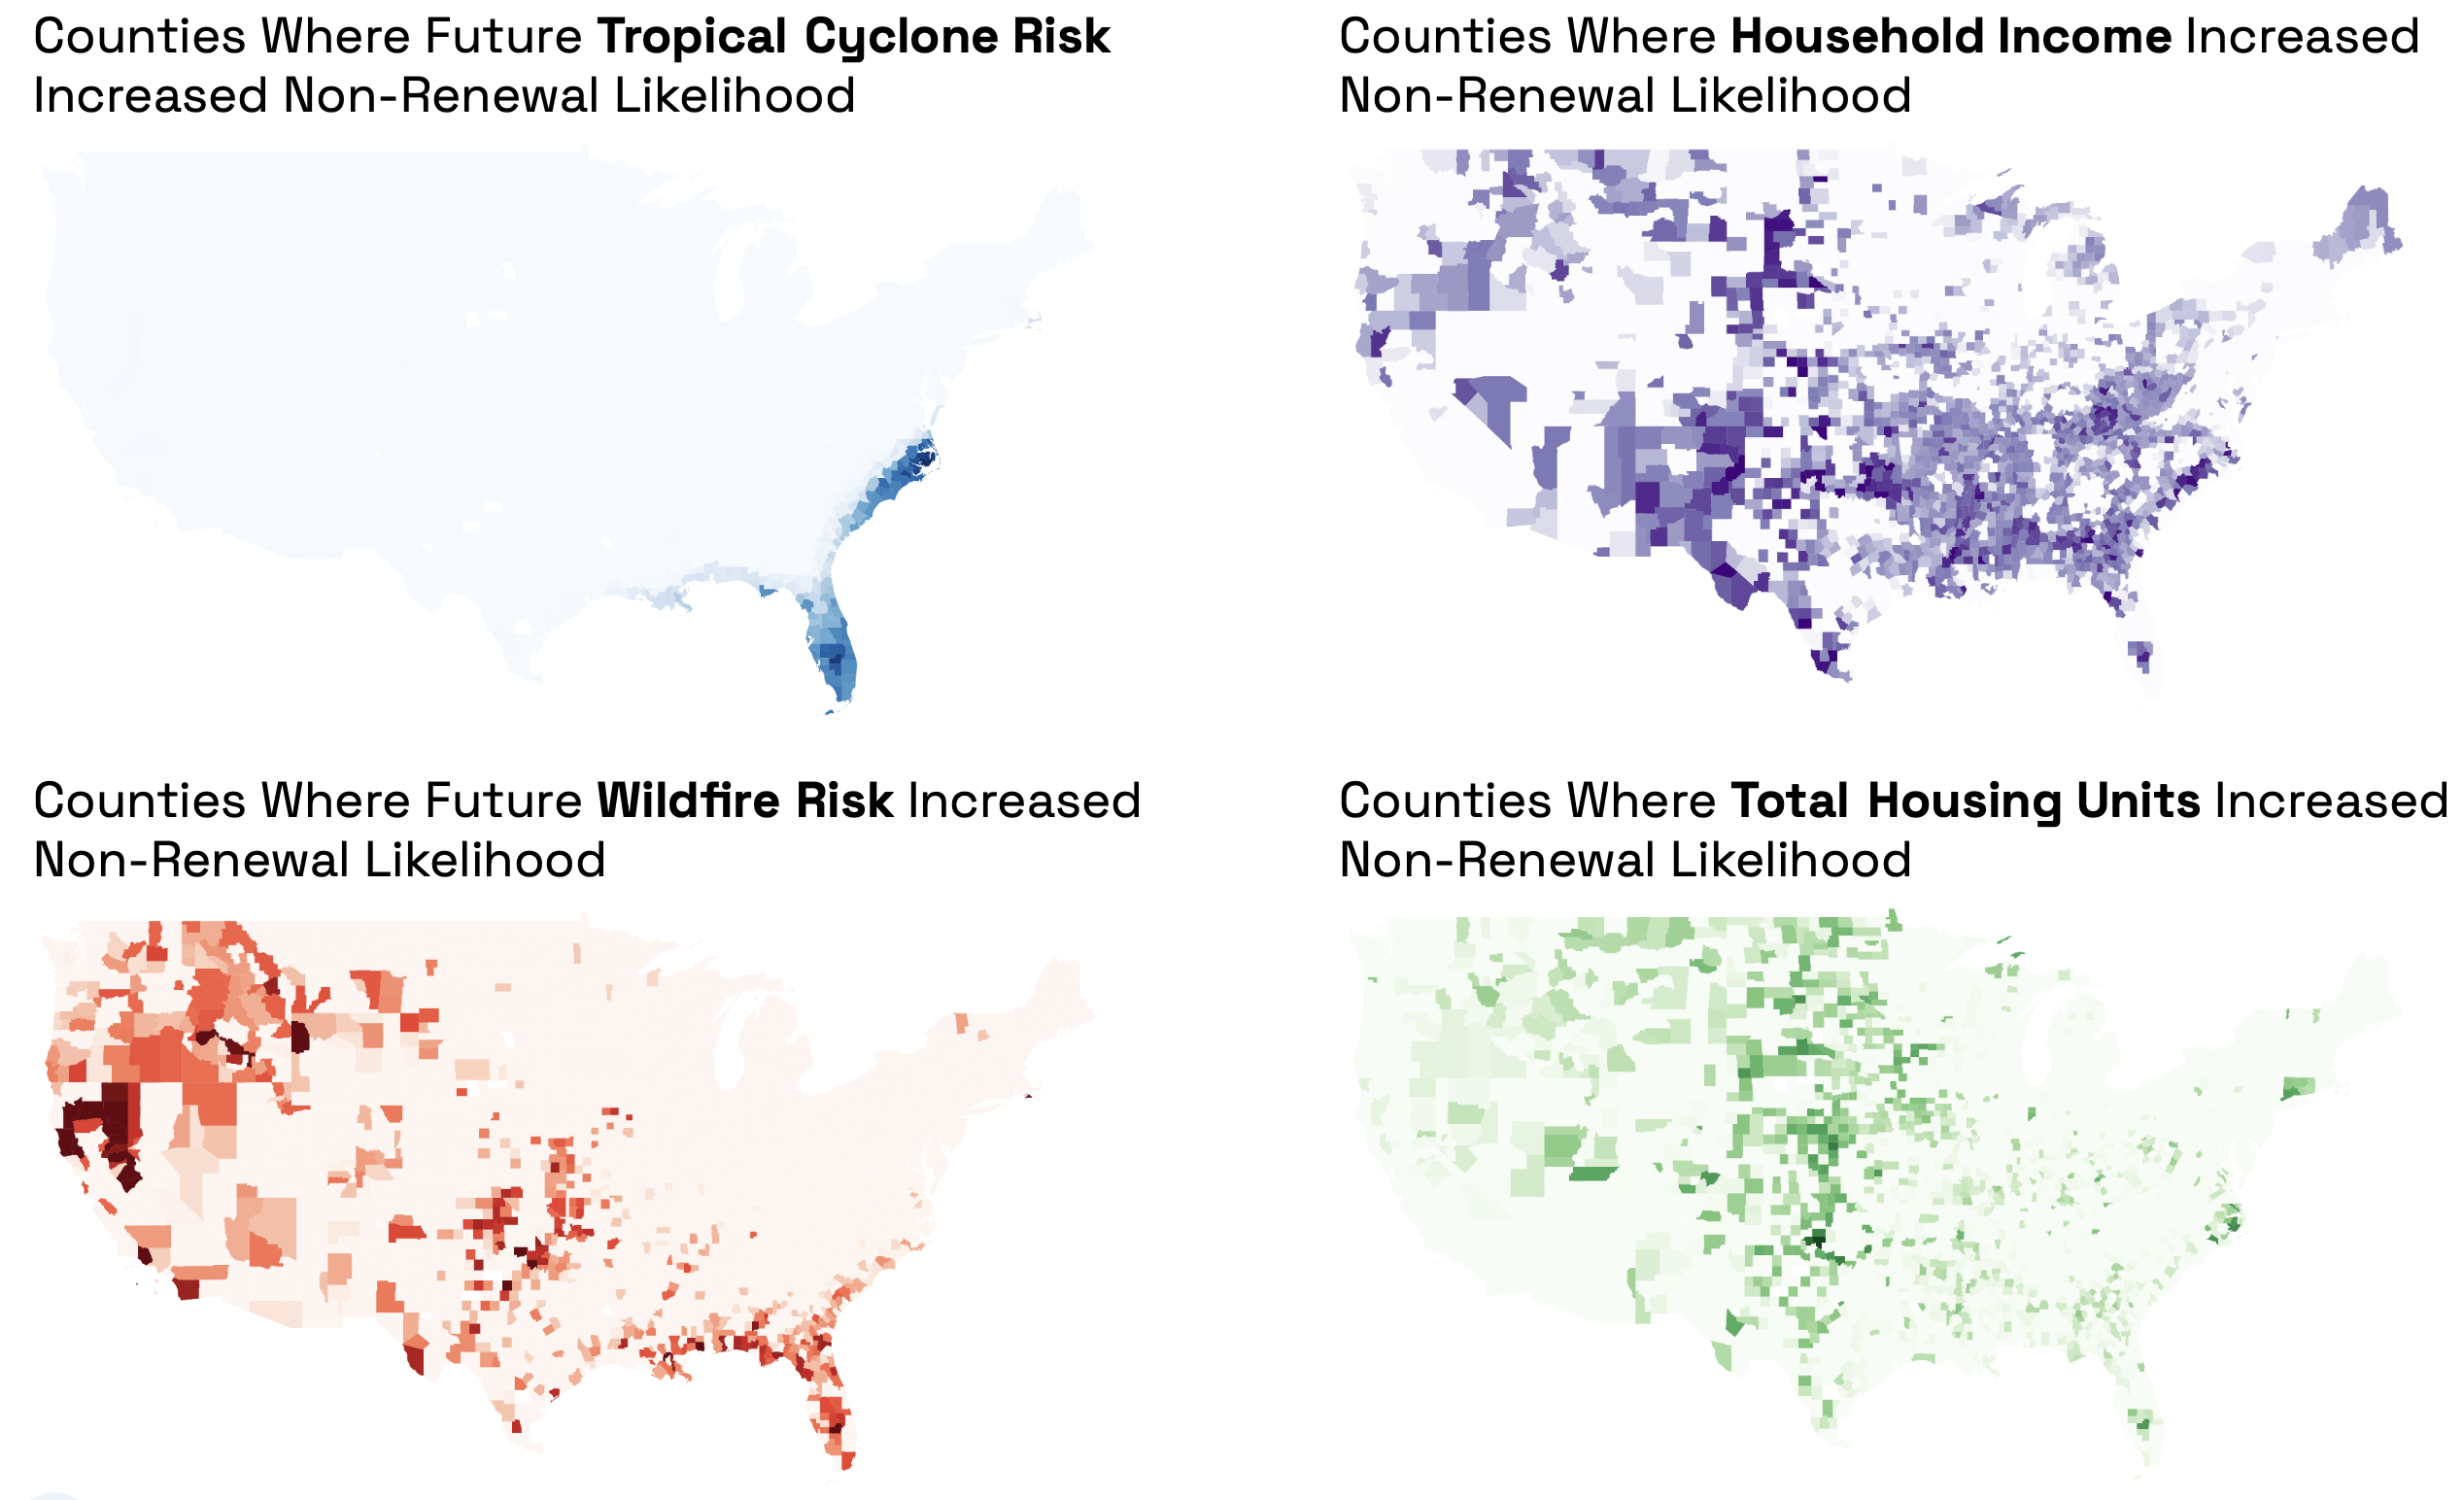 Figure 3: Mapping the Geographic Influence of Key Factors on Insurance Non-Renewals. These maps show how four key features influence predicted insurance non-renewal rates across U.S. counties, based on SHAP values. Brighter colors show where the feature had a greater effect on the model’s prediction, pushing it toward a higher likelihood of non-renewal.
The cyclone risk map reveals a distinct coastal pattern, with higher SHAP values (stronger influence on non-renewals) concentrated in Florida and extending up the Atlantic seaboard into North Carolina. This aligns with meteorological understanding of hurricane vulnerability and confirms that insurers are responding most strongly to cyclone risk in precisely the areas where it poses the greatest threat.
For wildfire risk, we see elevated SHAP values across much of the western United States, particularly in California, Oregon, and parts of the Mountain West. These are regions where wildfire frequency and intensity have increased significantly in recent years and are projected to worsen under climate change scenarios. The pattern suggests that wildfire risk is becoming a dominant factor in insurance decisions across a surprisingly large portion of the country.
The median household income and total housing units maps reveal a more complex pattern that appears to reflect an urban-rural divide. Counties with higher SHAP values for income and housing units (indicating stronger influence on non-renewals) tend to be concentrated in more rural areas, particularly across the South and Midwest. This suggests that insurers may be more sensitive to income levels in these regions, potentially leading to higher non-renewal rates in lower-income rural communities.
Why this matters: Building trust through interpretability
These insights into the drivers of insurance market trends aren't just academically interesting—they provide crucial transparency into the AI-driven modeling process. By showing that our model is "getting it right for the right reasons," we build trust in its predictions and recommendations.
The analysis confirms through a rigorous AI-driven approach incorporating hundreds of variables that climate factors are indeed heavily influencing non-renewals, as many experts have suggested. But it goes further by quantifying exactly how much different climate hazards matter, where they matter most, and how they interact with socioeconomic factors.
This provides a powerful lens for understanding and anticipating the climate-driven insurance crisis that is unfolding across the United States. For institutional investors, this means more accurate risk assessment and portfolio optimization. For policymakers, it offers data-driven guidance for targeted interventions and regulatory reforms. For communities, it highlights where adaptation and resilience measures could have the greatest impact.
The Populous framework's flexibility further enhances its practical value. While currently focused on insurance non-renewals, the architecture can be readily adapted to model different target variables by adjusting ground truth data and input features. The same interpretable approach can be applied to predict insurance losses, property values, loan defaults, or demographic shifts—all while maintaining transparent factor importance analysis. This adaptability transforms Populous from a single-purpose model into a versatile financial AI framework that can evolve to address multiple aspects of risk assessment across institutional portfolios.
Conclusion: The power of multimodal integration
The key insight from our research is clear: neither climate data alone nor socioeconomic variables in isolation can fully explain or predict insurance market dynamics. It's the fusion of these diverse data streams through multimodal AI that unlocks the most valuable insights.
The Populous framework demonstrates how advanced modeling techniques can transform disparate data sources into actionable intelligence about complex socio-economic phenomena. Populous represents a new learning representation that brings together spatially explicit risk factors, such as present day and future risk from climate hazards, with spatially implicit factors from population embeddings. By integrating Google's Population Dynamics Foundation Model embeddings with climate risk metrics, demographic data, and housing information, we've created a tool that captures the multifaceted reality of how markets respond to emerging risks.
As climate change continues to reshape our physical environment and challenge existing risk management paradigms, such multimodal approaches will become increasingly essential for investors, insurers, and policymakers seeking to navigate an uncertain future. The ability to not only predict outcomes but understand their drivers represents a significant advance in applied AI for financial decision-making.
Populous will be presented at ICLR2025 in Singapore, and you can read the full technical paper here. The framework will be integrated with Sust Global's geospatial AI solutions in Q2 2025, providing institutional users with unprecedented insights into climate-driven financial risks.
We invite institutional investors and technical AI professionals to engage further on this research and explore how these innovations can enhance your risk assessment and portfolio optimization strategies. Don't wait for the next crisis to expose the weaknesses in outdated models—reach out today to learn how Populous can transform your approach to climate risk.