Taiwan’s Increasing Threat of Cyclones: A Look at Frequency and Return Periods

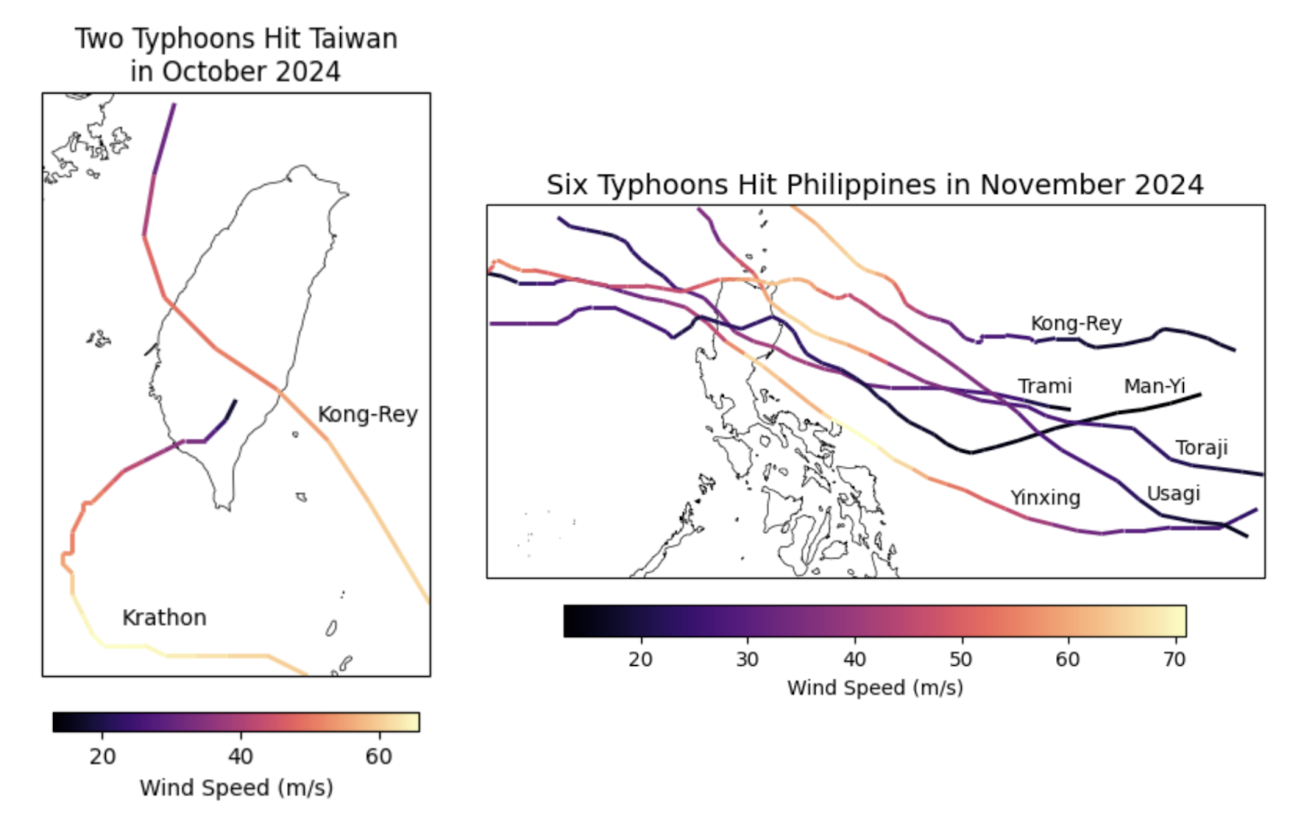
The unprecedented 2024 typhoon season in Taiwan, marked by three landfalling typhoons, including a record-breaking two in October (Fig. 1), underscores the increasing intensity and frequency of tropical cyclones worldwide. These powerful storms, also known as hurricanes or cyclones depending on their location, have become a significant threat to coastal communities. This late-season activity, coupled with the Philippines' historic experience of six typhoons in a single month (Fig. 1), highlights the potential for back-to-back cyclones and the need for accurate and reliable cyclone modeling to assess future risks. Figure 1. The exceptional 2024 cyclone season in Taiwan and the Philippines demonstrates how consecutive cyclones can escalate damage and increase overall risk.
Taiwan's typhoon season typically spans from July to September. The occurrence of two powerful typhoons in October is therefore quite unusual. Both storms attained Category 4 intensity on the Saffir-Simpson Hurricane Wind Scale, making their late-season appearance and strength particularly surprising.
The occurrence of typhoons in October in Taiwan, however, is becoming increasingly common, likely due to factors such as rising sea surface temperatures and changes in atmospheric circulation patterns associated with climate change. These changes can extend the typhoon season and create more favorable conditions for storm development and intensification.
Sust Global’s Approach to Cyclone Modeling
At Sust Global, we employ a comprehensive approach to cyclone modeling, building on established methodologies to enhance the projection of future cyclone activity and associated risks. Our approach leverages the STORM model, a peer-reviewed and widely used cyclone model, as the foundation for simulating cyclone genesis, tracks, and intensity based on historical data and projected climate conditions.
By integrating additional functionality such as observation-driven statistical bias correction, we enhance STORM’s framework to deliver improved accuracy at forecasting wind speed distributions. Factors like sea surface temperatures, atmospheric pressure, and historical cyclone tracks are incorporated, enabling robust analysis of future cyclone scenarios and their implications.
Understanding Return Periods
Return periods are statistical measures used to estimate the likelihood of a specific event occurring within a given timeframe. For instance, a 100-year return period event has a 1% chance of occurring in any given year. By analyzing historical data and future projections, we can calculate return period curves for wind speeds, providing valuable insights into the frequency and intensity of extreme events. Moreover, the STORM model allows us to simulate tens of thousands of scenarios, enabling us to assess the likelihood of rare events, such as 1-in-1000-year storms or two-typhoon Octobers in Taiwan.
These return period curves, coupled with wind damage functions, enable us to assess the potential structural damage caused by cyclones. By understanding the relationship between wind speed and damage, we can estimate the impact of various cyclone scenarios on buildings, infrastructure, and other assets.
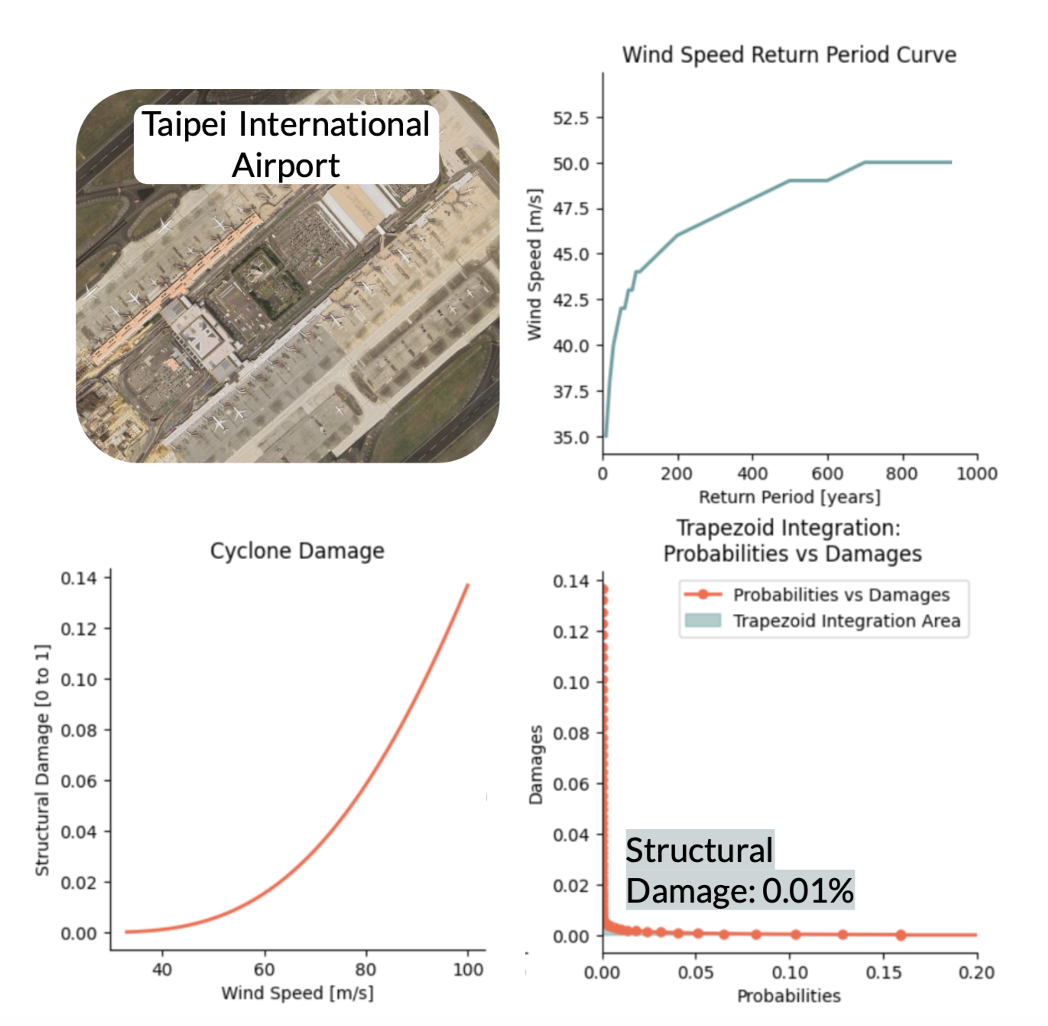
 Figure 2. Structural damage from tropical cyclones is estimated by combining two key factors: the return period curve, represented by the likelihood of various wind speeds (left), and the region specific wind-damage curve (middle). Using a trapezoid integration method, we calculate the area under the curve that combines these inputs, yielding the total estimated structural damage (right). Estimated structural damage here is low due to the high building standards, which result in lower wind-damage curves.
Figure 2 illustrates how we estimate the annual structural damage from a cyclone at Taiwan International Airport. This process involves combining the return period curve, which represents the likelihood of various wind speeds, and the region-specific wind-damage curve. By integrating these curves, we can calculate the total estimated structural damage. It's important to note that the estimated damage in this case (0.01%) is low due to the high building standards in the region, which result in lower wind-damage curves.
Climate Change and the Rising Threat of Cyclones
The increasing frequency and intensity of tropical cyclones, as exemplified by the 2024 typhoon season in Taiwan and the Philippines, is a growing concern. Climate change is projected to further exacerbate these trends, leading to more frequent and intense storms in the future.
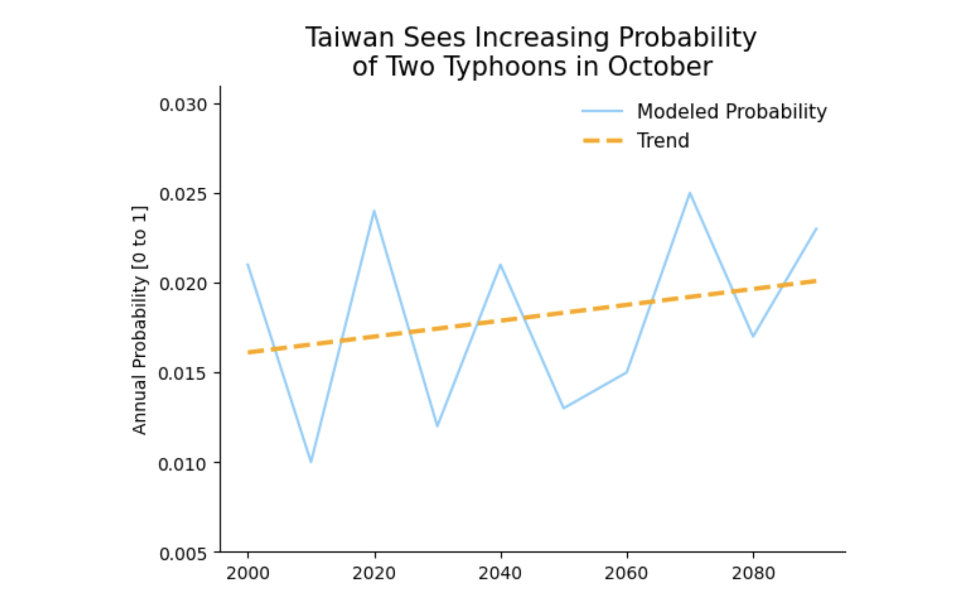
 Figure 3. Projected increase in the probability of two typhoons in October in Taiwan suggests that while the odds remain low, there is a significant upward trend (orange), with an 8% increase by 2050 and a 16% increase by 2080 compared to 2020 levels. This trend highlights the growing risk of late-season typhoon activity in Taiwan due to climate change.
Our analysis of historical and future climate data suggests that the probability of extreme cyclone events, such as the two-typhoon October in Taiwan, is likely to increase. While there is variability from decade to decade in our simulations, the overall trend shows an estimated 3% increase in this event by 2030 relative to 2020, an 8% increase by 2050, and a 16% increase by 2080 (Figure 3). Such increases suggest that late-season, back-to-back storms may become more commonplace. Results here are based on 10,000 simulations run under the High Emissions (SSP5-8.5) carbon emissions scenario.
While these increased typhoon frequencies can be a mixed blessing for Taiwan, providing much-needed rainfall to alleviate droughts, they also pose significant risks. During the severe drought of 2021, water shortages forced semiconductor manufacturers like Taiwan Semiconductor Manufacturing Company (TSMC) to implement water-saving measures and truck in water. Typhoon rainfall can alleviate such crises, but it can also lead to flooding and damage to infrastructure.
By understanding the potential risks and taking proactive measures, we can mitigate the devastating consequences of these powerful storms. Our advanced modeling techniques, coupled with a deep understanding of climate science, enable us to provide valuable insights to policymakers, businesses, and communities.